---
title: "Evaluation & Profiling"
description: "Measure useful edge AI outcomes with reproducible quality, latency, memory, energy and sustained-device tests."
---
> Documentation Index
> Fetch the complete documentation index at: https://latentlit.com/llms.txt
> Use this file to discover all available pages before exploring further.
# Evaluation & Profiling
import FocusCanvas from '../../../components/FocusCanvas.astro';
import ModelFlow from '../../../components/architectures/ModelFlow.astro';
import SourceFigure from '../../../components/architectures/SourceFigure.astro';
The useful question is whether an application completes the right task within
its device budget. Tokens per second can help explain one part of that result;
it cannot tell you whether the answer is correct, the first response is prompt,
memory peaks fit or a ten-minute session remains usable.
Evaluate the **whole workload**, then profile the expensive parts. This page
proposes a measurement contract for edge AI and explains how to read the resulting
evidence. It connects [efficient inference](/edge-ai/efficient-inference/),
[runtimes and compilers](/edge-ai/runtimes-compilers/) and
[production and product design](/edge-ai/production-product-design/).
The proposed examples and scorecards below are design guidance, not benchmark
results from this notebook.
## Define the task before choosing the metric
Start with inputs, acceptable outputs and the conditions in which the task runs.
A camera detector, an offline transcription system and a document assistant have
different workloads. A detector may need a result for every frame; a transcript
needs to remain accurate across an utterance; a summary needs enough source
coverage to be useful.
Write down the model and artifact revision, input processing, runtime and backend
versions, precision, device and OS, supported shapes, cache policy, decoding
settings and test fixtures. Preserve the same contract when comparing a baseline
and an optimization. If the candidate produces shorter answers or sees less
context, record that change as part of its behavior.
[Figure 1](#figure-1) separates a correct outcome from the costs of producing it.
Neither side can substitute for the other.
**Evaluate the outcome and the path under one contract**
**Fixed workload**
1. **Specify inputs and quality**: Retain representative fixtures, expected outcomes and failure criteria.
2. **Run the complete application**: Include preparation, model execution and delivery of usable output.
3. **Verify the result**: Grade correctness and inspect difficult cases.
Changing the model, context, processor or output budget creates a different candidate system.
**Recorded execution**
1. **Capture the timeline**: Cold start, first usable output, per-token gaps and completion.
2. **Capture device costs**: Peak memory, task energy and thermal behavior.
3. **Explain the difference**: Profile operators, transfers, allocation and host work.
Keep run-level data and settings; a single average cannot explain tails or sustained behavior.
**Figure 1.** Latent Light evaluation design, informed by app benchmarking, runtime profiling and MLPerf's separation of quality requirements and performance measurements.[^android-bench][^executorch-profile][^mlperf]
## Measure the timeline the user experiences
Use a monotonic clock and name the start and end events. A model call boundary
and a visible UI update are different measurement boundaries. For GPU or NPU
work, ensure the recorded completion includes required synchronization rather
than only the host's submission of asynchronous work.
| Metric | Proposed boundary and unit | What it resolves |
| --- | --- | --- |
| Cold readiness | App/session start to a usable model, milliseconds | Loading, initialization and any compilation cost |
| Time to first token, TTFT | Request acceptance to first delivered token, milliseconds | The initial wait, including preparation and prefill |
| Intertoken latency | Time between successive delivered tokens, milliseconds | Steadiness of continuation and visible stalls |
| Task completion latency | Request acceptance to final usable result, seconds | Total waiting time, including postprocessing and validation |
| Tail latency | A stated percentile of a stated run population | Rare slow runs, rather than only average behavior |
| Throughput | Completed tasks or delivered tokens per second, with concurrency | Capacity under a specified workload |
This is a proposed vocabulary, not a claim that every runtime uses these exact
definitions. State if TTFT excludes tokenization, includes loading or begins at
an earlier user action. For speech or vision, use first usable partial result and
the corresponding frame/chunk timing rather than forcing everything into tokens.
For **N delivered tokens**, with request accepted at
$t_0$ and token delivery timestamps
$t_1,\ldots,t_N$, a local calculation is:
$$
\begin{aligned} \mathrm{TTFT}&=t_1-t_0\\ \mathrm{mean\ intertoken\ latency}&=\frac{t_N-t_1}{N-1},\quad N\gt 1 \end{aligned}
\tag{1}
$$
These timestamps are in seconds. Keep individual gaps as well as their mean;
an average hides pauses. If a runtime emits a group of tokens at once, record
that batching behavior rather than interpreting equal delivery timestamps as
zero compute cost. One-token outputs have no intertoken interval.
As an illustrative example, the first token arrives at **0.8 s** and the 101st
at **4.8 s**, measured from acceptance. Mean intertoken latency is **40 ms**.
If final validation finishes at **5.2 s**, task completion is **5.2 s**, not
4.8 s. Report both. These are invented teaching timestamps, not a device test.
[Figure 2](#figure-2) places those timestamps on one path. The full-task boundary
extends past the last token because validation is part of making this result
usable. The token-gap bar represents the total interval, not uniformly paced
delivery; a distribution of individual gaps is still needed to find stalls.
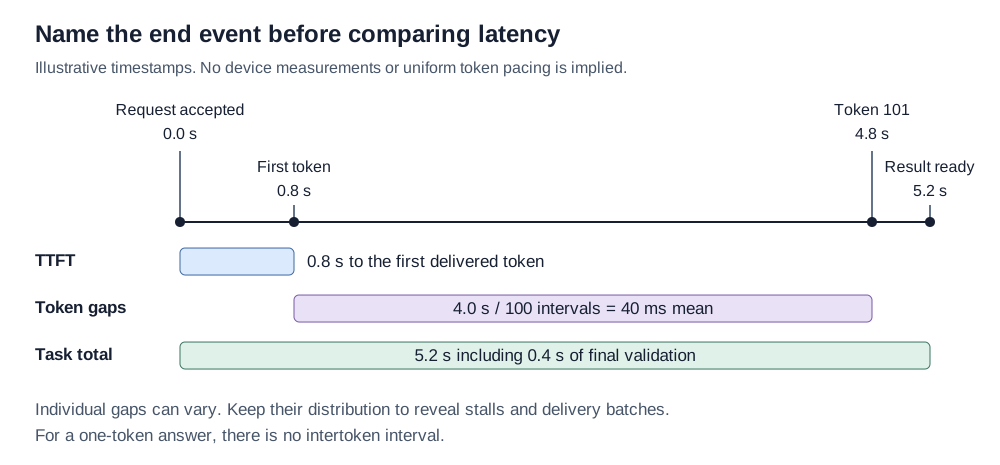
**Figure 2.** One trace, three latency questions. Latent Light derivation from the illustrative timestamps above; no measured device results and no assumption of equal individual gaps.
**Image description:** Illustrative latency boundaries: request accepted at 0 s, first token at 0.8 s, token 101 at 4.8 s and validated result at 5.2 s. The 100 token gaps span 4 s for a 40 ms mean. Final validation adds 0.4 s; individual token pacing is unspecified.
### Microbenchmarks have a narrower boundary
The inspected `llama-bench` documentation separates prompt processing (`pp`),
generation (`tg`) and combined processing/generation (`pg`), permits context-depth
tests and reports repetitions. It explicitly excludes tokenization and sampling
time. Its output is therefore useful kernel/runtime evidence, with a narrower
boundary than an application response.[^llama-bench]
Likewise, Android distinguishes end-user interactions measured by Macrobenchmark
from small code sections measured by Microbenchmark.[^android-bench]
Use a small benchmark to explain a bottleneck; preserve the full application
measurement that tells you whether fixing it matters.
## Quality must survive the optimization
Evaluate the candidate on the task distribution you care about. For an extractor,
check field correctness, omissions and schema validity. For speech, retain error
rates and hard audio conditions. For a summarizer, inspect factual support and
coverage. Separate fluent wording from correct content.
Pair performance measurements with outputs and run identifiers. Compare the
original and converted/quantized models, and compare the complete systems using
the same task fixtures. [Quantization and compression](/edge-ai/quantization-compression/)
and [training small models](/edge-ai/training-small-models/) explain why model
quality can change even when execution remains valid.
Match the comparison to the question. **Fixed-work** tests hold input length,
output budget and decoding policy constant to isolate execution. **Product**
tests allow natural stopping and measure success and total cost. Both are useful,
but a faster natural-stopping system might simply produce less content. Inspect
truncations, retries, cancellations and failures instead of silently discarding
them.
## Memory is more than the model file
Measure peak memory during initialization and during the largest relevant
workload, as well as steady residency. Include weights, KV state, intermediates,
backend arenas, input/output buffers and application memory. LiteRT's benchmark
tools distinguish initialization, warmup and steady-state inference, and include
initialization and overall memory metrics.[^litert-measure]
Record the measurement method: process resident memory, platform-reported
footprint or a backend allocation counter are not interchangeable. Shared
buffers and unified memory complicate addition; do not sum overlapping counters
and label the result physical memory. A device that can load a file may still
fail while allocating a long-context cache or a large image intermediate.
Test context-length and modality boundaries. See the explicit
[KV payload calculation](/edge-ai/efficient-inference/#the-context-is-a-growing-working-set)
for why a language model's state can grow substantially after loading.
## Energy should belong to a completed task
Power is a rate in watts; energy is accumulated work in joules. For a declared
measurement boundary from $t_a$ to
$t_b$, the local definition is:
$$
E_{\mathrm{task}}=\int_{t_a}^{t_b}P(t)\,dt
\tag{2}
$$
Here $P(t)$ is measured power in watts and time is in
seconds. Decide whether this is whole-device energy or energy attributed by a
platform counter. If subtracting an idle baseline, report the baseline procedure
and label the result incremental energy. Do not mix it with an unadjusted
whole-device result.
For a teaching example, **4 W for 5 s** is **20 J**. **6 W for 3 s** is
**18 J**. The faster system uses more instantaneous power yet less task energy
under these constant-power assumptions. Neither number establishes which system
will run longer on a battery in real use.
Use a calibrated external meter or an appropriate device counter when available,
and document its sampling interval, coverage and uncertainty. Battery percentage
is too coarse for a short-task energy claim. Include input processing, output
delivery and required retries within the chosen boundary. A proposed reliability
metric is total energy across all attempts divided by successful tasks, with the
failure count shown beside it. It prevents failed fast attempts from looking
artificially efficient.
## Cold, warm and sustained are three experiments
**Cold** tests expose app/session creation, loading and uncached compilation.
**Warm** tests examine reuse after initialization. Define exactly which caches
remain: model weights, compiled kernels and a reused prompt prefix represent
different advantages. A warm system that retains a large cache also retains its
memory cost.
**Sustained** tests ask whether the application remains useful through its
expected session. Android's Thermal API documentation explains that thermal
state depends on weather, prior usage and device design, and that high performance
may last only until throttling.[^thermal] Record elapsed time, latency and thermal
status during a realistic repeated workload, rather than just the first few runs.
Android Microbenchmark takes deliberate steps to stabilize measurements. It can
use sustained-performance mode and, when detecting thermal throttling, pause to
cool and retry. Those are valuable controls for reproducible microbenchmarks;
they do not establish performance of an uninterrupted product session.[^android-micro]
Keep two proposed tests: a controlled test for regression diagnosis and a realistic
session test for the product. Report whether devices were cooled, charged or
connected to external power, and whether screen, camera, microphone or radio
activity formed part of the workload. Do not claim a universal temperature or
session duration; choose conditions that match the application.
## Make device comparisons fair and repeatable
A useful comparison protocol retains these independent dimensions:
- **Workload:** public-safe fixtures, input lengths and modality sizes, context,
concurrency, output limits, decoding settings and quality checks.
- **Software:** artifact checksum, input processor, runtime/backend build, driver,
OS and compiler settings, including fallback and precision.
- **Device state:** processor/device model, memory, battery/charging state,
thermal starting condition, power mode and relevant background activity.
- **Measurement:** boundaries, synchronization, warmup, repetitions, run order,
raw timing/energy data, failed attempts and percentile calculation.
This is a proposed reproducibility contract. Keep a representative range of
inputs and repeat the workload enough to characterize variability. Alternate
or randomize candidate order when feasible, so accumulated heat or background
activity does not systematically favor one. Report sample count and uncertainty;
a p99 from a tiny sample cannot resolve a stable 1% tail.
For product comparisons between different tokenizers, do not assume that one
token is the same amount of content. Compare the same tasks and usable output,
and retain token counts as diagnostic metadata.
## Use benchmarks for the questions they answer
MLPerf Mobile defines workload, quality requirements and performance scenarios.
Its inspected summary uses a standard load generator and different metrics for
single-stream latency and offline throughput; the benchmark rules remain the
source of truth for a particular edition.[^mlperf]
[Figure 3](#figure-3) shows the original MLPerf Mobile harness. Model/dataset,
preprocessing, backend and postprocessing lie inside the functional system-under-test
envelope; LoadGen drives queries and records logs outside it. Crucially, that
envelope does not establish which operations are inside a latency timer. The
paper's Appendix E discusses preprocessing/postprocessing overhead and possible
extensions to measurement scope. Read the exact timing rules as well as the
diagram.[^mlperf-paper]
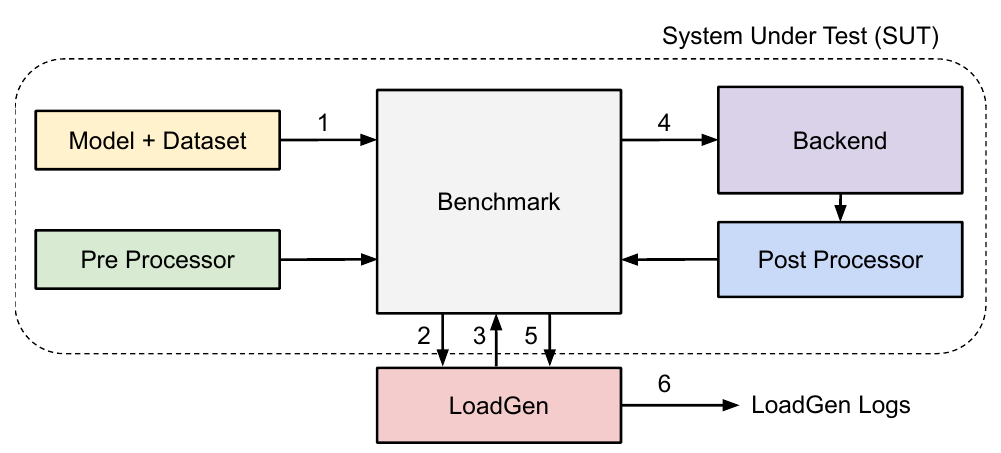
**Figure 3.** The test harness and its system boundary. Cropped from Reddi et al., MLPerf Mobile Inference Benchmark, 2022 v4, Figure 4, page 6; a historical measurement design, not current suite rules.[^mlperf-paper]
**Image description:** Original MLPerf Mobile LoadGen diagram: model and dataset, preprocessing, benchmark, backend and postprocessing sit inside the dashed system-under-test envelope. LoadGen exchanges queries and results with the benchmark and produces logs outside that envelope. The functional envelope does not itself identify every timed operation.
This 2022 figure explains why a benchmark needs both a system definition and a
timed boundary. Use the current edition's rules for a current submission.
That gives a disciplined comparison under the benchmark contract. It does not
establish app startup behavior, a private workload's quality, network fallback,
battery life or a sustained multimodal session. Record the suite edition, task,
model, quality target, scenario, division and submission configuration before
comparing results. Do not pool incompatible benchmark editions into one ranking.
This page does not reproduce a leaderboard. To assess a published result, inspect
its submission details and exact test conditions, then ask which parts of your
product contract remain untested. Standardized performance and product success
are related evidence, not interchangeable outcomes.
## Profile to explain, then remeasure the task
Once a complete workload reveals a regression, use a trace to locate it.
ExecuTorch 1.5 documents model-load, operator, delegate and end-to-end execution
timings. ETDump records runtime events; an optional ETRecord links them to model
source. Detailed delegated-operator timings depend on the delegate's integration
with the developer tools.[^executorch-profile]
Inspect expensive kernels, allocations, CPU work, synchronization and processor
boundaries. Distinguish host submission time from accelerator execution time.
Profiling adds work of its own, so establish the final latency and energy on
normal execution after using instrumentation to find the cause.
A proposed release decision might require acceptable quality, a TTFT budget, a
tail completion budget, a peak-memory ceiling and a sustained-session target
on each supported device class. Choose those thresholds from the task and user
experience, then retain the evidence. A single headline rate cannot substitute
for that contract.
[^android-bench]: Google, [Benchmark your app](https://developer.android.com/topic/performance/benchmarking/benchmarking-overview), Android Developers, inspected October 12, 2026. Macrobenchmark measures larger end-user interactions; the guide distinguishes benchmarking scopes.
[^executorch-profile]: PyTorch, [Profiling Models in ExecuTorch](https://docs.pytorch.org/executorch/stable/runtime-profiling.html), ExecuTorch 1.5 documentation inspected October 12, 2026. Metrics, ETRecord/ETDump workflow and delegate integration caveat; stable URL is mutable.
[^mlperf]: MLCommons, [MLPerf Inference: Mobile](https://mlcommons.org/benchmarks/inference-mobile/), inspected October 12, 2026. Scenarios & Metrics and Benchmarks; the page identifies benchmark rules as the source of truth. The live summary is mutable and includes multiple version labels.
[^llama-bench]: ggml-org, [llama-bench README](https://github.com/ggml-org/llama.cpp/blob/master/tools/llama-bench/README.md), master branch inspected October 12, 2026. `pp`, `tg`, `pg`, context-depth and repetition options; tokenization and sampling are excluded. Moving branch, not a pinned experiment.
[^litert-measure]: Google, [Benchmark Interpreter API](https://developers.google.com/edge/litert/models/measurement), inspected October 12, 2026. Initialization, warmup, steady-state inference and memory metrics; this page concerns the Interpreter benchmark tooling.
[^thermal]: Google, [Thermal API](https://developer.android.com/games/optimize/adpf/thermal), Android Developers, inspected October 12, 2026. Thermal-state constraints and monitoring; workload recommendations on this page are a Latent Light application to edge AI.
[^android-micro]: Google, [Microbenchmark](https://developer.android.com/topic/performance/benchmarking/microbenchmark-overview), Android Developers, inspected October 12, 2026. Lock clocks, Sustained performance mode and Automatic execution pausing.
[^mlperf-paper]: Vijay Janapa Reddi et al., [MLPerf Mobile Inference Benchmark](https://arxiv.org/pdf/2012.02328v4), 2022, arXiv v4 dated April 6, 2022, MLSys 2022. Figure 4 and Sections 4.1–4.3, page 6; Appendix E, page 17, discusses end-to-end preprocessing/postprocessing scope. The figure is reproduced as a bounded excerpt for review of its measurement boundary, not as current rules.
Source: https://latentlit.com/edge-ai/evaluation-profiling/index.mdx