InternVL 3 is a useful reminder that a simple visual interface can support substantial progress when the training and inference recipes improve. Its basic design remains vision encoder → MLP → language decoder. The interesting changes are how it learns across modalities, how it uses preference data, and how it spends extra inference computation.1
Highlights
- Joint learning from the start of this training run. Native multimodal pretraining updates all components on mixed visual and pure text content, instead of limiting an initial stage to the connector.
- High resolution through tiles. An image becomes 448 pixel tiles, with local visual features compressed before entering the language model.
- Three complementary feedback signals. Mixed Preference Optimization, or MPO, combines response preference, individual quality and preferred response generation.
- More than one inference answer. A separate visual process reward model can select among candidate solutions; those results must not be confused with ordinary single response generation.1
This page selects OpenGVLab/InternVL3-8B, the post MPO artifact, not InternVL3-8B-Instruct or the later 3.5 family. Public weights and inspectable custom code enable a concrete study. Report, card, configuration and targeted code were checked October 10, 2026. No weights or benchmarks were executed. 2
The model in numbers
| Quantity | Scope and meaning |
|---|---|
| Total parameters: 8.1B | Report Table 1, including vision and language components. Dense, not an MoE model. |
| Backbones | InternViT-300M-448px-V2.5 plus the Qwen2.5-7B base language model, not its instruct version. |
| Native pretraining: about 200B tokens | 50B pure language and 150B multimodal tokens under the reported 1:3 mixture. |
| SFT: 21.7M samples | Conversation and task examples, not the pretraining token count. |
| MPO: about 300K samples | Reported preference training set, generated using several SFT model sizes. |
| Image interface: 448 × 448 tiles | Each yields 256 language input vectors after spatial reduction. |
| Default spatial tile limit: 12, plus thumbnail | The selected configuration can add a thirteenth tile when tiling produces more than one. |
| Decoder base position limit: 32,768 | Configuration also specifies dynamic RoPE scaling with factor two. Neither proves a measured long context quality or memory guarantee. |
| FLOPs and checkpoint accelerator hours | Not disclosed in the inspected report. |
The report’s 8.1B total and artifact dimensions are stronger evidence than the 8B name alone. Configuration name strings can be stale: actual dimensions identify the selected 24 layer, width 1,024 vision encoder rather than a 6B vision backbone.12
Tiling and the visual interface
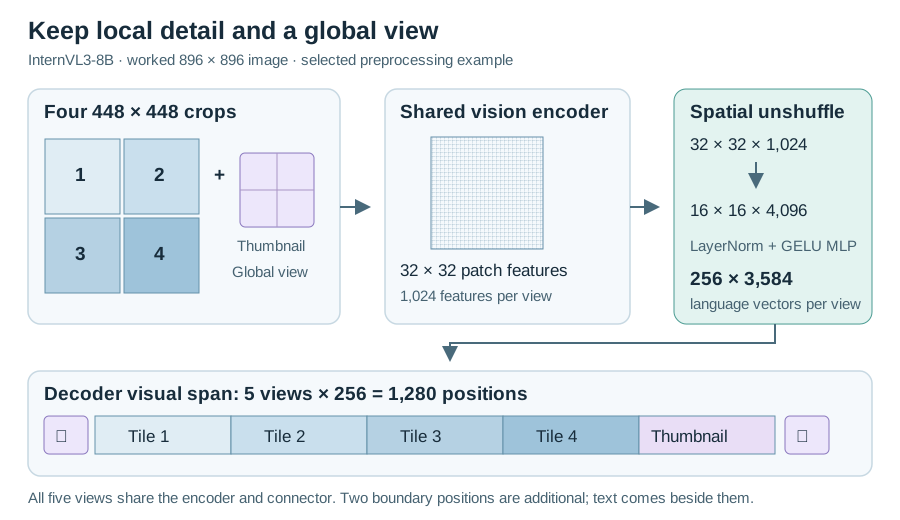
Figure 1. Four local crops and one global view become 1,280 visual positions. Original worked diagram based on the selected artifact.23
The card’s preprocessing example chooses a grid by aspect ratio, with an area rule to break ties. It resizes the image to that grid, crops its 448 × 448 tiles, and appends a resized global thumbnail when there is more than one tile. RGB conversion, bicubic tile resizing and ImageNet normalization prepare the actual tensor inputs. This is discrete tiling, not Qwen2-VL’s arbitrary rectangular patch grid.2
InternViT uses 14 pixel patches and learned image positions. The released model removes the class feature, reshapes the 1,024 patch features spatially, and applies a reduction called pixel_shuffle in code, implementing spatial unshuffle here. Four neighbors become one feature of width 4,096. LayerNorm and a two layer GELU MLP map that to the language width of 3,584.23
The decoder has 28 layers, 28 query heads and four key and value heads, with RMSNorm, SiLU gated FFNs and rotary positions. The selected wrapper inserts the projected vectors at image context positions; there is no separate decoder cross attention block for reading tiles.23
A tile budget you can calculate
For an 896 × 896 pixel image, the inspected example’s tie rules choose a 2 × 2 grid under the default maximum of 12. Four local tiles plus the thumbnail produce 1,280 visual tokens, with two additional image boundary positions before text and chat formatting. This is a derivation from the example and configuration, not an executed processor count.23
In Equation (1), tile count includes the thumbnail if present. The default maximum can therefore produce visual tokens for one image, not 12 × 256. Higher tile limits are an explicit cost and quality choice. They increase both encoder work and decoder context use.23
Video and positions
The selected usage example samples frames evenly, applies the same image preprocessing per frame, and labels each frame in the text prompt. Its eight frame demonstration uses one tile per frame, for 2,048 visual tokens, plus eight boundary pairs and frame label text. It is not Qwen’s two frame tube encoder or an audio model. More frames or more tiles multiply context cost; sparse frames can miss short events.2
The report also introduces Variable Visual Position Encoding, or V2PE. Text positions advance by one, while each visual position advances by a selected fractional increment. Training samples the increment per image from one down to 1/256. For 256 visual positions, an increment of 1/4 contributes 64 rather than 256 to accumulated position numbering. This does not remove visual vectors, attention work or key and value cache entries.1
The evidence boundary is important: all report results outside its V2PE ablation use increment one. The inspected default chat wrapper does not construct fractional image position indices; its forward method can accept position IDs, but that is not proof of a complete V2PE deployment path. Treat fractional positions as a reported training and ablation technique, not an automatically active inference feature.13
For a tiny example, assume one text position at zero followed by four visual vectors and another text position. Exclude image boundary tokens to isolate the recurrence:1
| Increment | Four visual coordinates | Next text coordinate | Visual sequence positions |
|---|---|---|---|
| One | 1, 2, 3, 4 | 5 | 4 |
| One quarter | 0.25, 0.5, 0.75, 1 | 2 | 4 |
This is an illustrative calculation of V2PE, not the default chat wrapper’s output. Fractional positions compress the coordinate span while leaving all four visual vectors and their cache entries in place.
Native multimodal pretraining
Native here describes joint optimization during this run, not training every component from scratch. Vision and language start from pretrained base models; the MLP is randomly initialized. All components update together on the mixture of captions, visual questions, OCR, documents, videos, GUI and spatial examples plus pure language content.1
The loss is autoregressive prediction on text targets. Visual vectors condition that prediction but are not themselves reconstruction targets. Gradients still flow through the visual encoder. The report gives a length weighting rule between pure token and pure sample averaging:1
Here, counts tokens whose losses are computed in that sample, not its total visual and text context length. Compared with unweighted token sums, this reduces the dominance of long responses; compared with dividing by , it does not give every sample exactly equal total weight. Batch normalization and packing still matter when implementing this objective.1
The authors select the 1:3 language to multimodal ratio through experiments under a fixed total budget. The lesson is balance, not that this ratio is optimal for every dataset. The report does not expose the complete original optimizer and data mixture recipe for independent reproduction.1
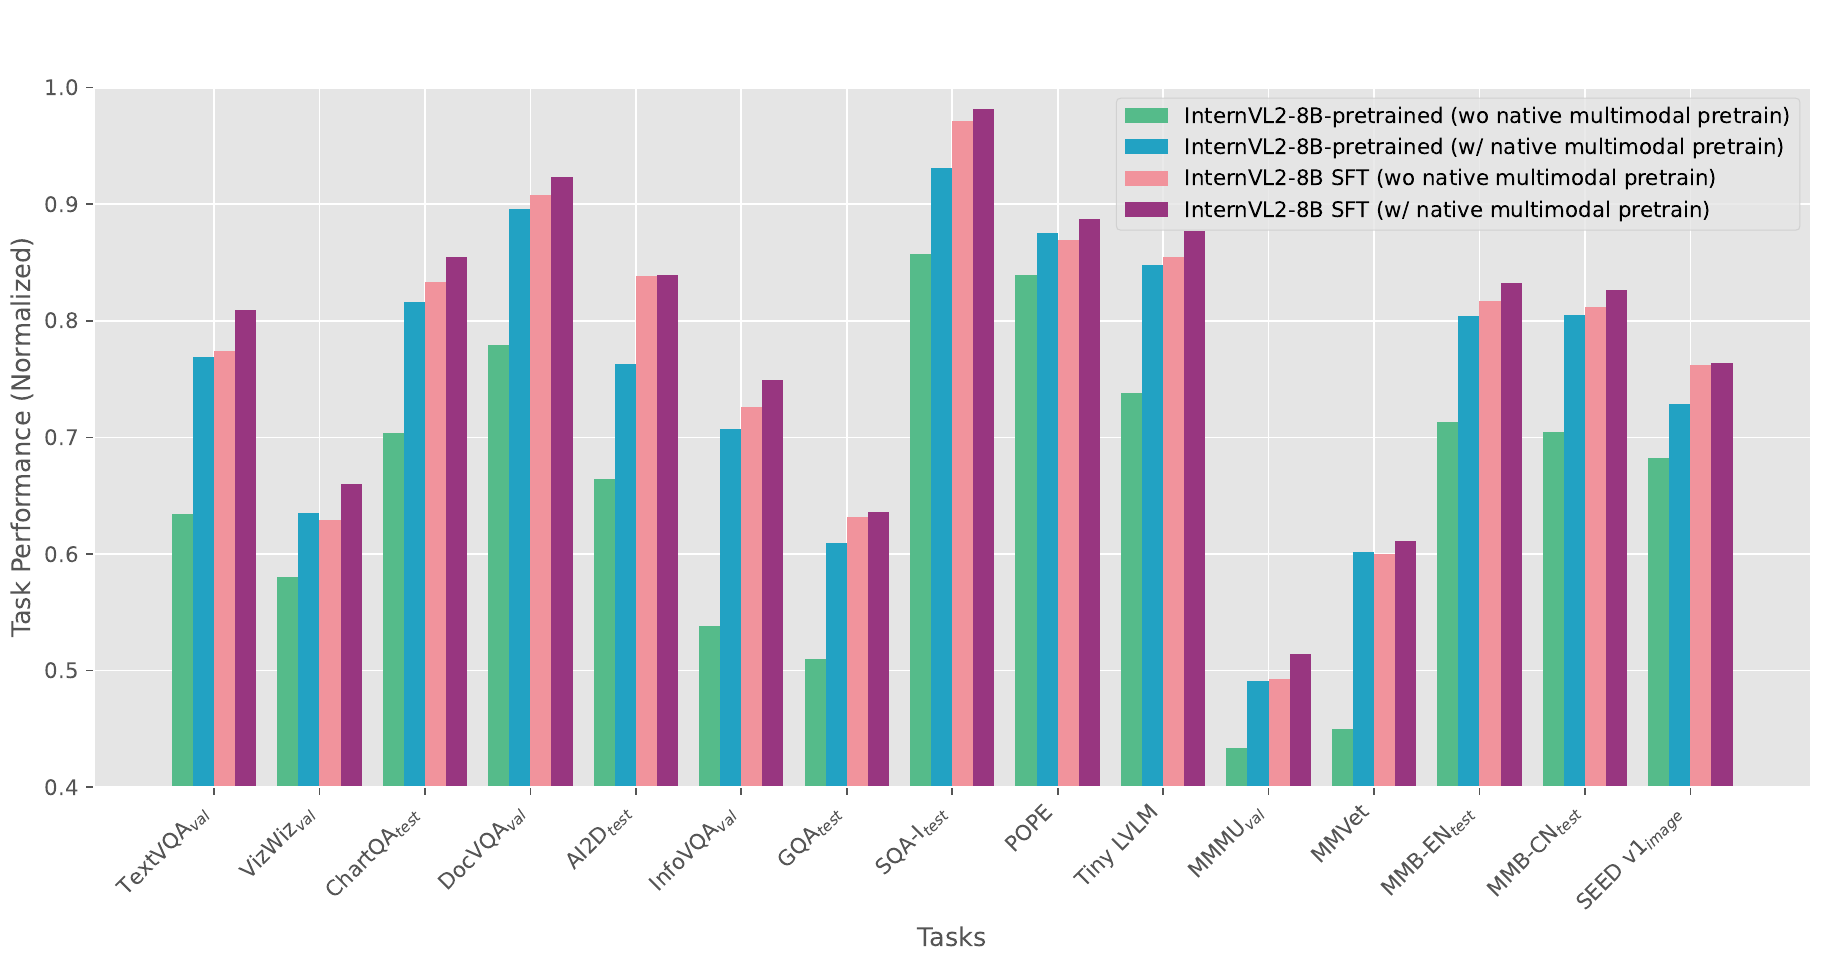
Figure 2. Native versus post-hoc training. Zhu et al., Figure 3; cropped, CC BY 4.0.4
Figure 2 is a controlled InternVL2-8B experiment, not a direct leaderboard comparison of the selected InternVL3-8B checkpoint. Section 3.14 keeps its architecture, initialization and data unchanged while replacing the MLP alignment warmup with native multimodal pretraining. The pretrained native model approaches the conventional SFT baseline on most tasks; subsequent SFT adds gains in the tested settings. The axis is benchmark-normalized and starts at 0.4, so bar lengths are not raw accuracies or comparable absolute task difficulties.1
Training throughput is a separate systems claim
The report uses InternEVO to shard the vision, connector and language components with data, tensor, sequence and pipeline parallelism. Different modality mixes create uneven work across those components, so coordinated sharding matters. The authors report 50% to 200% higher training throughput under comparable compute conditions. This is a family level training infrastructure claim, not an 8B serving latency measurement or a reproduced benchmark.1
SFT and Mixed Preference Optimization
SFT expands the task mixture to 21.7M examples and uses random JPEG compression, length weighting and multimodal packing. The report describes the stage at family level rather than exhaustively enumerating every release’s frozen parameter groups. A repository script named second finetune starts from the already released model, so its frozen vision setting must not be retroactively presented as the original SFT training run.15
MPO adds fixed chosen and rejected responses. It combines three objectives: 1
- DPO compares the chosen and rejected response relative to a reference policy, learning their ordering.
- BCO separately classifies the relative quality of each response, using a moving reward shift for stability.
- Language modeling preserves generation of the chosen response instead of optimizing only a relative preference score.1
Preference ordering and individual quality are distinct losses
Let be the initial SFT reference policy and the policy being updated. For a prompt , chosen response and rejected response , the report uses the following reference relative reward and loss forms:1
Here, scales the reference relative score, is the logistic sigmoid and is BCO’s moving reward shift. This page uses eta for that shift to avoid confusing it with the visual position increment. DPO can improve the margin between two responses without separately fixing their quality levels; BCO supplies that individual response signal. The reference policy in these losses is not the VisualPRM critic used later for test time selection.1
This is offline preference optimization on collected pairs, not an online rollout algorithm such as PPO or GRPO. The selected card identifies an Instruct predecessor. The published 8B MPO script starts from that predecessor, updates vision, MLP and language components, and sets one epoch, total batch 256, learning rate , weight decay 0.05, 3% warmup and cosine decay. It specifies DPO and BCO weights 0.8 and 0.2 plus generation regularization. These are inspected script settings, not a verified execution log.25
The report’s MPO set has about 300K examples, using responses generated by the 8B, 38B and 78B SFT models. These are collected preference examples, not evidence that the current policy performs fresh online rollouts at every training step.1 The public MMPR-v1.2 card checked today describes a later, roughly 3M sample collection for InternVL 3.5. The same dataset name does not establish byte for byte access to the 300K historical subset or prove that later training settings match this release.16
Test-time selection and what is measured
VisualPRM-8B scores intermediate solution steps by the probability of a positive correctness label, then averages step scores to rank complete solutions. Best of eight samples eight candidates and adds this separate critic. It spends more generation and scoring compute than one ordinary response; its gains are not a free architectural improvement.1
| Evidence | Selected result and condition |
|---|---|
| 8B, single response, Table 2 | MMMU 62.7; MathVista 71.6. With VisualPRM best of eight: 66.0 and 75.2. |
| 8B, Table 3 | DocVQA test 92.7; TextVQA validation 80.2; OCRBench 880. Scores use different metrics and scales. |
| 8B, video Table 8 | Video-MME 66.3 without subtitles and 68.9 with subtitles. The report tests 16, 32, 48 and 64 frames and reports the maximum. |
| MPO ablation, Table 13 | Selected 8B reasoning average 41.4 to 44.3; MathVista 67.4 to 71.6. This compares SFT and MPO variants. |
Video-MME results are therefore not an eight frame serving benchmark. Likewise, the native pretraining experiment is conducted on an InternVL2-8B system with controlled architecture, initialization and data, not a clean ablation of every difference in the final InternVL 3 model.1
V2PE’s Table 12 uses the pretrained 8B model, not the post MPO artifact. Its overall score changes from 75.2 without V2PE to 75.9 with increment 1/4, but 1/256 scores 75.0. More positional compression is not monotonically better, and the reported index benefit is not physical cache compression. 1
The report also checks language capabilities after multimodal training. Table 11 gives the 8B model 77.3 MMLU versus 74.2 for its Qwen2.5-7B Chat comparison, but 78.1 HumanEval versus 82.3 and 69.3 MBPP versus 74.3. These are release comparisons with different training histories, not controlled proof that multimodal data causes each change. Maintaining language capability does not mean uniformly improving every language task.1
MPO is not uniformly beneficial at every scale either: in Table 13’s separate 1B comparison, MathVista falls from 47.2 to 45.8 while the reasoning average rises from 24.6 to 25.1. That counterexample should not be hidden by the selected 8B model’s average gain.1
Limits and reusable lessons
The checkpoint requires custom code in its documented Transformers workflow. Pin and inspect that code before granting trust. Its generation wrapper explicitly enables caching, despite a false use_cache field in the nested language configuration; reading one flag alone would misdescribe inference. No deployment or memory benchmark was run here.23
License metadata also needs care. The selected card labels the checkpoint Apache 2.0 but links to an unrelated Qwen 72B license. The actual selected Qwen2.5-7B backbone license is Apache 2.0; the vision card and repository identify MIT terms. This mismatch is disclosed rather than interpreted as unambiguous legal clearance for the combined artifact. Training sources retain their own terms.27
The durable lesson is separate representation, training feedback and inference budget. Tiles retain detail, spatial reduction controls sequence growth, joint pretraining protects mixed capabilities, and preference training changes response behavior. Best of multiple candidates is a separate system choice. Evaluate each at the actual resolution, frame count, generation and critic budget you intend to use.
For the other design direction, read Qwen3-VL on adaptive patch grids and visual depth connections. Transformer foundations explains causal generation, losses and the difference between positional indices and retained sequence length.
References
-
InternVL Team. InternVL3: Exploring Advanced Training and Test-Time Recipes for Open-Source Multimodal Models, 2025, sections 2 and 3. Tables 1, 2, 3, 8, 11, 12 and 13 checked in the versioned PDF. Figure 3 is reproduced with separately recorded attribution and rights. The final paragraph of section 3.14 bounds other results to V2PE increment one. ↩ ↩2 ↩3 ↩4 ↩5 ↩6 ↩7 ↩8 ↩9 ↩10 ↩11 ↩12 ↩13 ↩14 ↩15 ↩16 ↩17 ↩18 ↩19 ↩20 ↩21 ↩22 ↩23 ↩24
-
OpenGVLab. InternVL3-8B selected artifact. Config, card, dynamic preprocessing and video usage inspected October 10, 2026; public weight files identified without downloading them. ↩ ↩2 ↩3 ↩4 ↩5 ↩6 ↩7 ↩8 ↩9 ↩10 ↩11 ↩12
-
OpenGVLab. Pinned custom inference code, constructor, extract_feature, pixel_shuffle, chat placeholder expansion and generate inspected. Spatial reduction and cache statements are source inspection, not runtime evidence. ↩ ↩2 ↩3 ↩4 ↩5 ↩6 ↩7
-
Jinguo Zhu et al. InternVL3: Exploring Advanced Training and Test-Time Recipes for Open-Source Multimodal Models, Figure 3 and section 3.14, PDF page 18. The selected arXiv version explicitly links CC BY 4.0. Extracted at 300 dpi; cropped to the plot with axes and legend unchanged. This report figure tests native training using InternVL2-8B; it is not an InternVL3-8B checkpoint score chart. ↩
-
OpenGVLab. 8B MPO script, MPO training entry and second finetune example. A supplied script is not a historical run record. ↩ ↩2
-
OpenGVLab. MMPR-v1.2 data card, inspected October 10, 2026. Its later 3.5 scale is not the report’s 300K subset. ↩
-
OpenGVLab. MIT code license; vision backbone card, MIT; Qwen Team, Qwen2.5-7B license, Apache 2.0. Current backbone terms checked October 10, 2026; selected checkpoint metadata mismatch retained as a limitation. ↩